
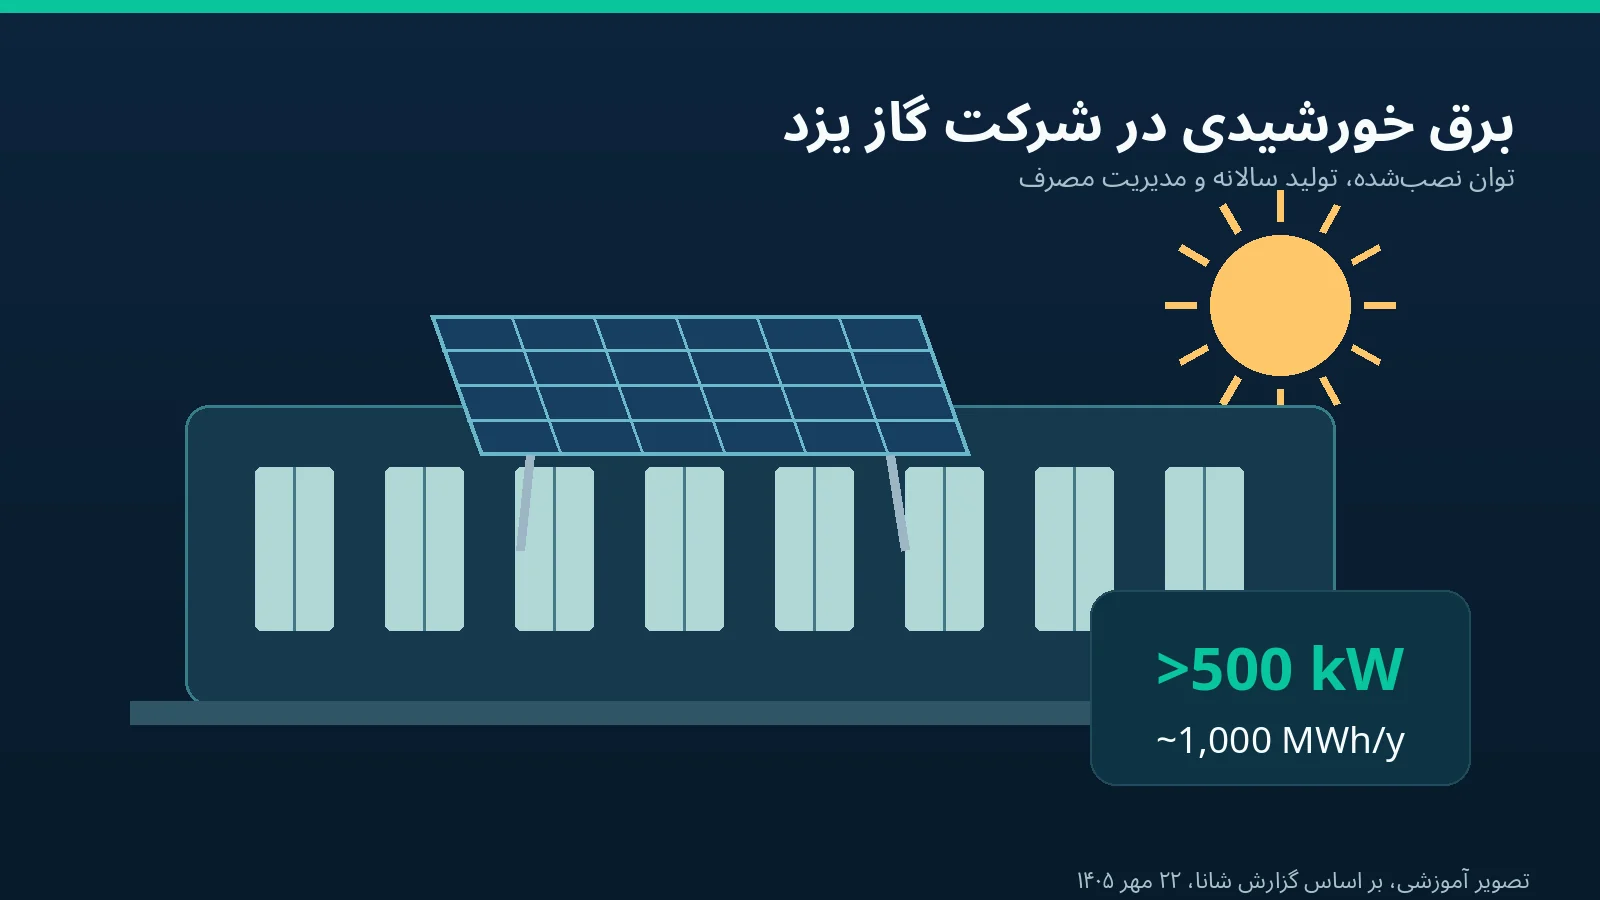
Developing solar power within a gas company is more than a change in electricity supply: it reflects an interest in efficiency across the energy chain. In news published on 22 Mehr 1405 (14 October 2026), Yazd Province Gas Company said that expanding its solar facilities had enabled renewable generation equivalent to the annual electricity consumption of its administrative buildings. Alongside installed capacity, the announcement also concerns energy audits and building efficiency.
For readers of Ekbatan Gas Control, this case helps distinguish generating capacity, energy produced, actual consumption and measured savings. The same distinctions matter when monitoring gas use, interpreting meter data and evaluating efficiency projects. This article reviews the reported figures, the limits of their interpretation and practical lessons for energy management.
What did the official announcement say?
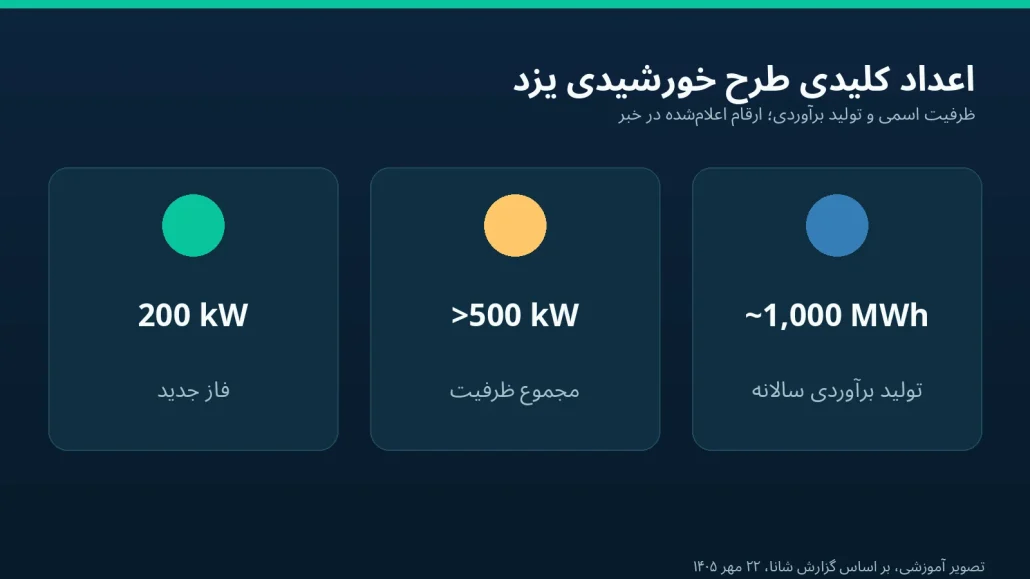
According to Shana’s report of 22 Mehr 1405 at 12:58, the company’s managing director said that a new 200 kW phase had brought its total rated solar capacity to more than 500 kW. Estimated annual generation was approximately 1,000 MWh, enabling the equivalent of 100% of the electricity required by its administrative buildings across the province to be supplied.
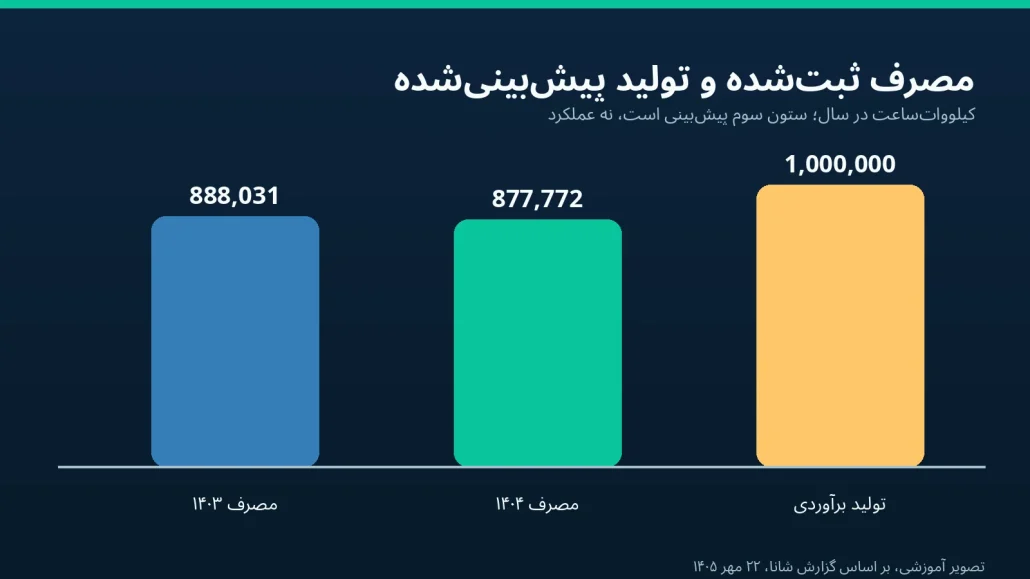
The same report put those buildings’ electricity consumption at 888,031 kWh in Iranian year 1403 and 877,772 kWh in 1404. It also described energy audits across all buildings and planned measures including smart controls, a second entrance door and improved thermal insulation. These figures and plans concern Yazd Province Gas Company and must not be attributed to Ekbatan.
Reading the numbers correctly
Power and energy have different units. Kilowatts describe capacity or instantaneous power; kilowatt-hours and megawatt-hours describe energy over a period. More than 500 kW of rated capacity and about 1,000 MWh of expected annual generation are therefore different indicators and cannot be used interchangeably.
| Reported indicator | Value | Interpretation |
|---|---|---|
| New solar phase | 200 kW | Rated capacity of the new phase |
| Total solar capacity | More than 500 kW | Reported installed capacity |
| Estimated annual generation | Approximately 1,000 MWh | A forecast, not measured annual output |
| Administrative electricity use in 1403 | 888,031 kWh | Recorded consumption for that year |
| Administrative electricity use in 1404 | 877,772 kWh | Recorded consumption for that year |
Converting the annual generation estimate gives approximately one million kWh, about 122,228 kWh more than the reported consumption in 1404. The simple ratio of forecast output to that historical consumption is close to 1.14. This does not prove that solar panels directly supply the buildings at every hour of the day.
Annual coverage and continuous supply are different
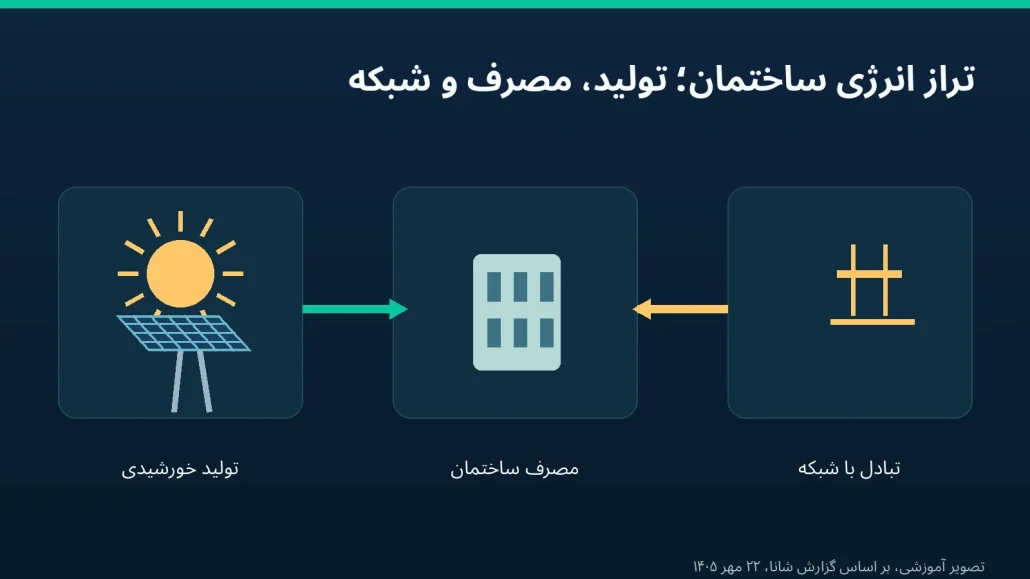
Solar panels do not generate at night, and output changes with season, cloud cover, temperature and equipment condition. Buildings also have their own hourly load patterns. Assessing instantaneous self-supply requires load profiles, measured hourly generation, grid exchanges and information about storage. The official news does not provide these details. The supported interpretation is potential annual energy equivalence based on forecast production, rather than complete independence from the electricity grid.
Why energy audits matter alongside solar power
Solar panels address supply; audits and equipment improvements address demand. If a building uses unnecessary energy because of poor insulation, unsuitable heating or cooling settings or inefficient lighting, adding generation alone does not resolve the efficiency problem. Reducing avoidable use allows the same solar capacity to cover a larger share of actual demand.
The Yazd report mentions audits of all buildings, but an audit alone does not establish achieved savings. Evaluation requires records of corrective actions, implementation dates, consumption before and after, weather and operating hours. Even the year-to-year fall from 888,031 to 877,772 kWh cannot, without operating context, establish the effect of a particular action.
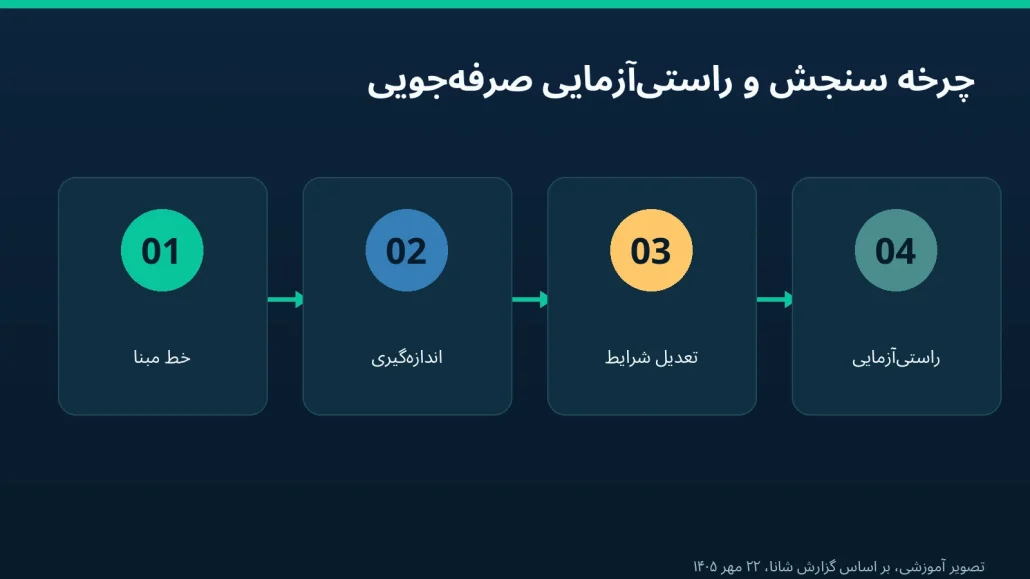
Three steps for assessing actual results
- Define a clear consumption baseline, including the period, building boundary and data quality.
- Measure solar production, electricity purchased from the grid and final consumption separately, with time references.
- Report results after adjusting for temperature, working hours, staff numbers and changes in building use.
What this means for gas and smart metering
Although the announcement concerns solar electricity, gas network energy management follows similar principles. Reliable decisions require an identified measuring point, correct units, timestamps, data quality and comparable periods. A gas meter records consumption at a defined location; converting that reading into a savings analysis depends on the measurement method, reference conditions and demand factors.
In buildings using both electricity and gas, analysing one carrier alone is insufficient. Switching heating from gas to electricity, for example, may reduce gas use while increasing electricity use. Without a combined energy balance, this transfer could be mistaken for net savings. Efficiency programmes should separately assess both carriers, costs and environmental effects.
From periodic readings to actionable data
Remote reading and advanced metering infrastructure can improve access to consumption data, but more data alone does not reduce use. Value appears when data are valid, timestamped and analysable, and alerts lead to operational action. Unexpected out-of-hours consumption, for instance, should prompt a review of operating schedules and equipment condition rather than an immediate diagnosis of a leak or failure.
As a participant in the gas measurement equipment industry, Ekbatan Gas Control can use such cases to explain measurement principles, data quality and demand management. This article makes no claim that Ekbatan supplied equipment to the Yazd project or that its products have any particular unverified capability.
Indicators for a building energy project
Useful indicators describe both the quantity and quality of performance. One overall energy coverage percentage may help public communication, but is insufficient for daily management. Several complementary indicators give a more accurate view.
| Indicator | Question answered | Control point |
|---|---|---|
| Measured solar output | How much electricity was generated? | Record kWh and the time interval |
| Total building consumption | How much energy was used? | Define the measurement boundary and consumers |
| Grid imports and exports | When was there a shortfall or surplus? | Separate received and exported energy |
| Energy intensity | How much was used per area or activity? | Adjust for weather and building use |
| Equipment availability | How long was the system ready to operate? | Separate planned and unplanned downtime |
Reading quality and communications health also matter. Missing data, inconsistent equipment clocks or abrupt setting changes can distort calculations. A professional report should state its data sources, calculation methods, assumptions and limits so comparisons between periods are defensible.
Lessons for building and industrial managers
Clean generation and demand reduction complement one another. Forecasts should not be presented as established performance. Facilities, finance, IT and operations teams also need to coordinate data collection and decisions; without that coordination, even accurate equipment can produce inconsistent reports.
Before announcing savings
Specify whether a figure concerns electricity or gas, the comparison period, whether temperature and working hours have been adjusted, whether readings come from valid meters and whether a change in energy carrier has been mistaken for savings. Also distinguish capacity, forecast output and measured production or consumption.
From solar capacity to a culture of reliable measurement
The Yazd announcement shows how a gas industry organisation can develop renewable electricity and improve its buildings alongside its main function. Reported solar capacity exceeds 500 kW, with estimated annual generation around 1,000 MWh. Additional operating data are needed to verify achieved output and instantaneous supply patterns.
The practical lesson is that an efficiency project can be evaluated when technology is accompanied by valid measurement, a clear baseline and careful interpretation. These principles also support better decisions about gas meters and energy consumption management.
Sources and use of the data
The main news source is Shana’s report on solar electricity for Yazd Gas Company’s administrative buildings, 22 Mehr 1405, report 3036790. Capacity, forecast generation and consumption for 1403 and 1404 come from that report. The MWh-to-kWh conversion and numerical difference are explanatory calculations in this article, not new operating results.
Frequently asked questions
How much solar capacity does Yazd Gas Company have?
According to Shana’s 22 Mehr 1405 report, total rated solar capacity exceeded 500 kW after commissioning the new 200 kW phase.
Are its administrative buildings powered by solar energy at all hours?
The news describes potential annual energy equivalence. Without hourly data, storage information and grid exchanges, continuous supply or complete grid independence cannot be established.
What annual generation was announced?
Approximately 1,000 MWh per year was estimated, rather than reported as actual energy generated over a complete year.
What was administrative electricity consumption in 1404?
The reported figure for the company’s administrative buildings across the province was 877,772 kWh.
How does an energy audit differ from installing panels?
An audit identifies consumption patterns and opportunities to reduce waste. Solar panels generate electricity. The two approaches can complement each other.
How does this relate to gas meters?
Baselines, valid measurement and comparable periods are also essential for gas monitoring. The news does not establish Ekbatan’s involvement in the Yazd project.